
An interactive implementation is available at Latvian License Plate Price Estimator.
1. Data Scarcity and Motivation
This work explores the factors that influence perceived value of Latvian license plates as a pattern recognition problem. It is intended as an academic study of pricing patterns, not as a tool to facilitate transactions.
The Data Problem
No official transaction data for license plate sales exists in Latvia. The Road Traffic Safety Directorate (CSDD) manages plate registration but does not publish auction results or historical sale prices. In fact, CSDD has publicly stated it will not research the "plate fashion market." The secondary market for plates operates in a legal gray area; under Article 265 of the Latvian Criminal Law, plates are assigned for use rather than owned as property, and trading them can carry penalties. This legal ambiguity means no clean, official dataset of confirmed transactions is available.
The only observable price signals come from online marketplace listings. These represent asking prices, not confirmed sales, which introduces significant noise. Sellers often list plates at inflated prices, and many listings never result in transactions. The ratio of listings to actual sales is substantial, with far more stated prices than revealed transactions. This is a common challenge in markets for unique or illiquid goods, similar to real estate or collectibles, where stated preferences diverge from revealed preferences.
What Makes a Plate Valuable?
Latvian license plates follow a standard format: two letters, a hyphen, and one to four digits (e.g., AA-1234). The full 26-letter Latin alphabet is used, and digits range from 1 to 9999. Unlike some countries, Latvian plates do not encode region in the letter pair, so letters serve primarily aesthetic and mnemonic purposes.
Several factors influence perceived value. Personal meaning plays a significant role; buyers seek plates matching their initials, surnames, birth years, or other significant dates. Historical significance also matters. Plates from the "AA" series, for instance, were the first issued after Latvia restored independence and established CSDD in late 1991, giving them collectible appeal. Lucky or repeating numbers (777, 1111), short digit sequences, recognizable words, and memorable abbreviations all command premium prices.
However, plate valuation is highly subjective. A combination meaningful to one person may hold no appeal to another. This subjectivity, combined with inflated listing prices and general market inflation over the years (which may not directly translate to this niche domain), makes price prediction a challenging task.
Motivation
This project began from curiosity. No prior machine learning projects existed for Latvian license plate valuation, and very few related works addressed similar problems with comparable data scarcity. The challenge of predicting value from short text strings, with limited sales data supplemented by a larger pool of listings, presented a unique Machine Learning problem worth exploring.
2. Data Retrieval, Processing, and Cleaning
Data collection drew from two primary source types: online marketplace listings and social media posts. The marketplace data included both active listings and a smaller set of confirmed sales spanning 2009 to 2025. Social media data came from trading groups where users post plates for sale, often with images rather than structured text. In total, the dataset comprises approximately 8,000 social media posts yielding around 15,000 processed entries with roughly 7,000 unique plates, supplemented by around 500 marketplace listings and 50 confirmed sales.
Extraction Pipeline
A significant portion of social media listings contained images of plates rather than text descriptions. To extract structured data, vision language models (Gemini 2.5 Flash Lite and Gemini 3 Flash Preview) were used to identify plate numbers and prices from post images and text. This approach handled the variety of formats encountered: some posts contained only an image of the plate, others included prices in the caption, and many had relevant information scattered across comments.
Comments proved particularly valuable. Beyond the original posts, comment threads often contained price offers, alternative plate suggestions, and community reactions. Extracting offers from comments required processing conversational text where users might reference the original post, reply to other comments, or use informal language.
Sarcasm and Price Validation
Without prior domain expertise in plate valuation, community reactions provided a useful signal for building intuition about price reasonableness. Posts with fairly priced plates tended to accumulate straightforward likes, while those with inflated prices often attracted a mix of reaction types and sarcastic comments mocking the asking price. This pattern proved genuinely helpful for identifying overpriced listings during manual review.
The challenge arose when attempting to automate this signal. Detecting sarcasm reliably is difficult; research has shown that both humans and LLMs struggle with sarcasm detection, exhibiting low agreement even in controlled settings [1]. For Latvian specifically, the limited availability of training data in the language may further complicate matters, though the fundamental difficulty of sarcasm detection likely applies regardless of language.
Despite the inconsistency in automated sarcasm detection, LLM based extraction significantly reduced the manual review burden. The models successfully filtered the large volume of raw posts down to a manageable subset requiring human verification.
Data Cleaning Challenges
Several cleaning challenges emerged during processing. The same plate could appear multiple times across different posts and time periods, often at different prices. For the initial dataset, this was addressed by averaging prices across listings, though this approach has limitations when prices reflect different market conditions over time. Understanding whether a listed price was reasonable required contextual judgment, sometimes informed by comment reactions, comparison with similar sold or listed plates, but often requiring manual assessment. Outlier detection using IQR (Interquartile Range) and Z-score methods helped identify and flag suspicious entries for review.
The final cleaned dataset retained approximately 1500 entries with valid plate formats, reasonable price ranges, and sufficient confidence in the extracted values.
3. Previous Similar Works
License plate price prediction has received limited academic attention, with most prior work focusing on markets with official auction data and strong cultural numerology factors.
Hong Kong Auction Studies
The most comprehensive research comes from Hong Kong, where government held auctions provide clean transaction data. Chow [2] proposed treating plate price prediction as a natural language processing task, constructing a deep recurrent neural network to predict auction prices based on plate characters. Using 52,926 auction entries spanning 1997 to 2010, the model explained over 80 percent of price variation, significantly outperforming prior approaches. A follow-up study [3] extended this work with deep residual learning on a larger dataset of 104,994 entries, finding that convolutional networks outperformed recurrent networks for comparable model complexity.
These studies benefit from several advantages absent in the Latvian context. Hong Kong auctions produce confirmed sale prices rather than asking prices, and the dataset sizes are two orders of magnitude larger. Additionally, Hong Kong plate values are heavily influenced by Chinese numerological superstition, where numbers like 8 (prosperity) and 9 (longevity) carry strong cultural significance, and combinations that rhyme with auspicious phrases command premium prices.
Dubai License Plates
Research on Dubai plates [4] has also explored machine learning approaches for price prediction, though the full methodology is not publicly available.
Russian Plates Kaggle Competition
A Kaggle competition on Russian license plate price prediction [5] presents a scenario more similar to this work. The competition dataset contains approximately 51,600 entries with around 43,600 unique plates, sourced from Telegram channels and websites rather than official auctions. Russian plates use a format of one letter, three digits, and two letters (e.g., A777BX), drawn from 12 Cyrillic characters that resemble Latin letters. Valuable patterns include repeating digits (777, 999), first ordinals (001, 007), and combinations matching regional codes. The competition uses SMAPE as the evaluation metric, with the best performing entry achieving a score of 33.45%. SMAPE (Symmetric Mean Absolute Percentage Error) measures prediction accuracy as a percentage, ranging from 0% (perfect) to 200% (worst), treating over-predictions and under-predictions symmetrically. It remains unclear whether the evaluation ground truth consists of actual sale prices or listing prices; if the latter, the metric reflects accuracy against potentially noisy asking prices rather than true market value.
Differences from This Work
The Latvian case differs from prior work in several respects. The dataset is substantially smaller, with roughly 50 confirmed sales compared to tens of thousands in other studies. Cultural factors diverge as well; rather than numerological superstition, Latvian plate values depend more on personal meaning such as matching initials, surnames, significant dates, abbreviations. The reliance on listing prices rather than confirmed transactions introduces noise, as asking prices often exceed what buyers actually pay. These constraints motivated different modeling choices, particularly around uncertainty quantification and the treatment of price as a range rather than a point estimate.
4. Assumptions, Feature Engineering, and Initial Goal Metrics
Domain Assumptions
Several factors drive license plate value in Latvia. Personal meaning plays a central role: buyers seek plates matching their name and surname initials (e.g., "JB" for Jānis Bērziņš), birth years, or other significant dates. Memorability matters as well; short digit sequences, repeating patterns like 777 or 1111, and palindromes command premiums. Recognizable abbreviations and aesthetically pleasing letter combinations round out the value drivers.
A fundamental challenge is the latent demand problem. A plates value is highly personal: "AB-1985" might be worth high premium to someone born in 1985 with initials AB, yet hold effectively zero value to everyone else. Listing prices may reflect what sellers believe someone might pay, introducing systematic upward bias. You could argue that the model attempts to capture potential maximum willingness-to-pay rather than market clearing prices.
One simplifying factor is that Latvian plates do not encode geography in the letter pair, unlike some countries where letters indicate region of registration. This means letters serve primarily aesthetic and mnemonic purposes, which simplifies feature design.
Feature Engineering
Features were organized into five categories capturing different aspects of plate appeal.
Structural features capture basic composition: digit count, unique character count, and equality patterns (whether both letters match, whether all digits are identical). Pattern features identify memorable arrangements: palindromes, ascending or descending sequences, round numbers, and adjacent duplicate digits. Numeric features quantify digit properties: Shannon entropy, digit sum and variance, and counts of culturally significant digits like 7 and 8. Letter pair features capture several aspects: whether both letters are identical (e.g., "AA", "BB"), whether the combination forms a recognizable abbreviation, and how likely the initials are to match common Latvian name and surname pairs.
The letter pair features presented a particular challenge. Knowing that name and surname combinations drive value, initial letter pair likelihood was computed using publicly available Latvian name and surname frequency statistics. The naive approach multiplied P(firstname starts with X) by P(surname starts with Y) to produce a continuous "initials score". However, this feature hurt model performance.
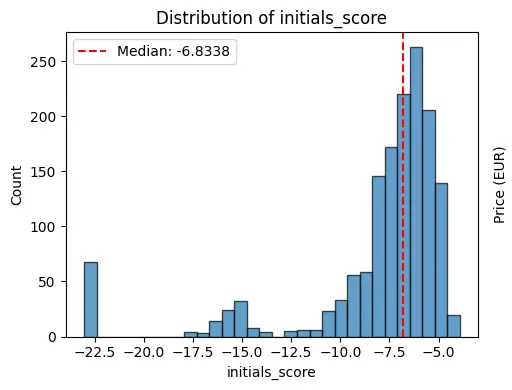
The distribution reveals the problem. Most plates cluster around common initial combinations, while a long tail extends toward rare pairs. With a limited dataset, many letter pairs had few or no examples, making the continuous score noisy and unreliable. The solution was a binary feature, is_top_9_initials, indicating whether the letter pair falls within the top 9% most common name and surname combinations. This coarser representation proved more robust given the data constraints.
Feature importance analysis using permutation importance guided feature selection. Features providing no meaningful contribution, often due to correlation with more important features, were removed from the final set.
Target Transformation
Prices in the dataset are heavily right skewed. The majority of plates lie between €100 and €1000, with a long tail extending to €15,000. Summary statistics reflect this asymmetry: the median price is €450 while the mean is €677, with a standard deviation of €857.
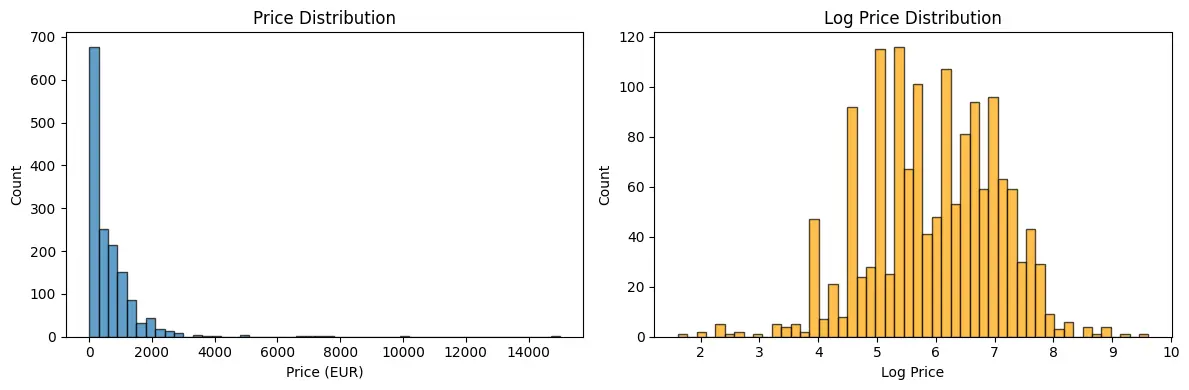
To address this skew, log-transformed price was used as the prediction target. Beyond producing a more symmetric distribution better suited for regression, log transformation has an intuitive interpretation for prediction errors. A €100 error on a €200 plate represents a 50% deviation, far more significant than a €100 error on a €5000 plate (2% deviation). Training on log-transformed prices ensures the model penalizes proportional errors more equally: predicting €300 for a €200 plate incurs a similar penalty to predicting €7500 for a €5000 plate.
Initial Goal Metrics
Given the constraints of the problem, a small dataset with limited confirmed sales, reliance primarily on listing prices, and high subjectivity in valuation, predicting a single point estimate seemed overconfident. A prediction of "€500" implies false precision when the true value depends heavily on finding the right buyer. Instead, the goal was to produce prediction intervals: a range within which the true value likely falls.
Two metrics guided the initial design: coverage and interval width.
Coverage measures the proportion of true values that fall within predicted intervals. Standard uncertainty quantification studies often target 90-95% coverage [6]. However, achieving high coverage with noisy, limited data requires very wide intervals. A 70% coverage target represents a pragmatic tradeoff: the model provides a reasonable range for most predictions while keeping intervals narrow enough to be actionable. This accepts that roughly 3 in 10 predictions may fall outside the interval in exchange for useful output.
Interval width determines how informative the predictions are [7]. Consider a plate predicted at €500: an interval of [€300, €700] provides useful guidance, while an interval of [€100, €2500] spans most of the practical price range and offers little value. With a median listing price of €450 in this dataset, an interval width target of €700 represents approximately 1.5× the median, was determined to be enough range to capture market variability while remaining informative.
These targets are inherently linked: higher coverage requires wider intervals, while narrower intervals sacrifice coverage. The 70% coverage and €700 width combination represents an initial target balancing these competing objectives, calibrated to the datasets characteristics and intended as a starting point for iteration.
5. First Base Model and Results
Model Choice
XGBoost was selected as the base model for several reasons. It handles small datasets well without requiring extensive hyperparameter tuning, provides interpretable feature importance scores, and supports quantile regression natively.
To produce prediction intervals directly, three separate XGBoost models were trained using quantile regression: one for the 15th percentile (lower bound), one for the 50th percentile (median prediction), and one for the 85th percentile (upper bound). Together, the q15 and q85 predictions form a 70% prediction interval.
Hyperparameter Optimization
Optuna was used for hyperparameter optimization. The optimized parameters were then applied to all three quantile models to maintain consistency across the interval bounds.
Point Prediction Performance
The median model (q50) achieved the following performance on 5-fold cross-validation:
| Metric | Value |
|---|---|
| MAE | €297 (±34) |
| R² | 0.42 (±0.10) |
R² (coefficient of determination) measures how much of the variation in prices can be attributed to the features the model uses. An R² of 0.42 means 42% of why plates have different prices is captured by features like digit count, repeating patterns, and initial combinations, et cetera. The remaining 58% comes from factors the model cannot capture: buyer specific preferences (for example, someones personal birthday or initials), negotiation dynamics, market timing, features not included in the model, and noise inherent in listing prices that may not reflect actual transaction values.
Whether 0.42 is "good" depends on the domain. In physical sciences with controlled experiments, R² values above 0.7 or even 0.9 are typical. In social sciences, where human behavior introduces unpredictability, values as low as 0.1 may be acceptable if predictors are statistically significant, with 0.1-0.5 being commonly observed [8]. Professional hedonic pricing models for art and collectibles, which face similar challenges of subjective valuation, typically achieve R² of 0.65-0.85, but these rely on much larger datasets with established auction markets [9].
The MAE of €297 means predictions are off by about €300 on average, which is substantial relative to the median price of €450 but reflects the difficulty of the prediction task.
Coverage Analysis
The combined q15-q85 interval achieved approximately 70% overall coverage, meeting the initial target. However, examining coverage by price segment revealed a noticeable problem:
| Price Segment | Coverage |
|---|---|
| <€200 | 64% |
| €200-500 | 83% |
| €500-1k | 81% |
| €1k-2k | 54% |
| >€2k | 40% |
Coverage is strong for mid-range plates (€200-1000) at around 80%, but drops substantially for both cheap plates under €200 (64%) and expensive plates over €2000 (40%). This pattern suggests the model struggles with extremes: very expensive plates may represent rare premium combinations that the limited training data cannot adequately characterize.
Interval Width Scaling
Interval widths scale with predicted price, a natural consequence of training on log-transformed targets:
| Price Segment | Mean Width | Relative Width |
|---|---|---|
| <€200 | €437 | 189% |
| €200-500 | €503 | 167% |
| €500-1k | €711 | 112% |
| €1k-2k | €1060 | 103% |
| >€2k | €1737 | 115% |
The overall mean interval width of €661 is close to the €700 target. However, the relative width (interval width as percentage of segment midpoint) reveals that intervals are proportionally wider for cheaper plates. A €437 interval on a €100 plate spans a much larger relative range than a €1737 interval on a €3000 plate.
Limitations and Next Steps
The baseline model revealed several limitations. The uneven coverage across price segments highlights a fundamental problem with training quantile models independently: each model optimizes its own quantile loss without coordination, and there is no mechanism ensuring that the combined interval achieves consistent coverage across different subpopulations of the data. Additionally, the model treats all training examples equally, despite confirmed sales being more reliable price signals than listing prices, which may be inflated. Historical sales prices spanning multiple years are not adjusted for inflation, potentially confusing the model with temporal price drift.
These findings motivated several refinements: weighting confirmed sales more heavily than listings to emphasize reliable price signals, adjusting historical prices for inflation, applying a discount to listing prices under the assumption they are inflated, expanding the feature set, and adopting conformal prediction methods which provide distribution free coverage guarantees and can be calibrated in post-hoc manner. The next section describes these improvements.
6. Model Improvements
Data Quality Refinements
Three adjustments addressed the data reliability issues identified in the baseline.
Sale weighting. Confirmed sales represent actual transactions, while listings reflect only asking prices that may never result in a sale. To emphasize these more reliable price signals, confirmed sales were weighted more heavily during training. Hyperparameter sweeps tested weights ranging from 1× to 10× for sales relative to listings; a 3× weight combined with a 5% listing price discount yielded the best calibration performance.
Inflation adjustment. Sales data spans 2009-2025, a period during which Latvian consumer prices increased by roughly 50%. A plate that sold for €500 in 2012 would cost approximately €650 in 2024 terms. Historical prices were adjusted to 2024 EUR using the Latvian Consumer Price Index (CPI). Whether the license plate market followed general inflation is uncertain; plate values may have appreciated faster or slower than consumer goods depending on collector demand and market maturity. This adjustment represents a necessary assumption that may introduce slight bias, but unadjusted prices mix temporal effects with feature effects, making it harder for the model to isolate what drives value.
Listing price discount. Listing prices are systematically inflated relative to transaction prices. Research on eBays Best Offer platform, analyzing over 88 million listings, found that items sell for approximately 83% of list price on average, with discounts reaching 27% when bargaining occurs [10]. Similar patterns appear across classifieds and negotiated markets. To account for this, a discount was applied to non-sale entries under the assumption that actual transaction prices would be lower. Combined with sale weighting, hyperparameter sweeps determined that a 5% discount with 3× sale weight produced the best calibrated intervals.
AutoGluon Ensemble
AutoGluon is an open-source AutoML framework that automates model selection, hyperparameter tuning, and ensemble construction [12]. Given a dataset and time budget, it trains multiple model families (gradient boosting, neural networks, random forests) and combines them into a weighted ensemble. This approach was adopted for the final model because AutoGluon's automatic stacking often outperforms individual tuned models, and the ensemble's diverse learners could better exploit a richer feature set.
Expanded Feature Engineering
The baseline model used 9 curated features that proved to be most informative. The refined model expanded this to 21 features from the full feature extractor, adding properties such as whether the plate ends in 0 or 00 (round number appeal), standard deviation of digit differences (capturing regularity in digit patterns), and additional letter-based features. This expansion was motivated by observing that AutoGluon's neural network models could utilize a richer feature set more effectively than the single XGBoost baseline; ensemble methods with diverse learners benefit from having more signals to work with, even if individual features contribute only marginally.
Conformal Prediction for Calibrated Intervals
The baseline approach of training separate quantile models (q15, q50, q85) achieved 70% overall coverage but with substantial variation across price segments. This happens because each quantile model optimizes independently; there is no mechanism coordinating them to produce calibrated intervals.
Conformal prediction provides a principled alternative. Rather than training models to directly predict quantile bounds, conformal methods calibrate intervals in a post-hoc manner using held-out data. The intuition is straightforward: given a single trained point-prediction model, compute residuals on a calibration set to measure how far predictions were from true values, then use the distribution of these residuals to construct intervals for new predictions.
Consider the simplest approach using absolute errors. First, generate predictions on a held-out calibration set and compute the absolute residual for each sample: |actual - predicted|. These residuals might look like: [12, 45, 23, 78, 31, 56, 19, 89, 42, 28, ...]. To achieve 70% coverage, find the 85th percentile of these residuals; suppose this value is q̂ = 67. At inference time, for a new prediction of €500, the interval becomes [500 - 67, 500 + 67] = [€433, €567]. The coverage guarantee is distribution-free: regardless of the underlying data distribution, approximately 70% of new samples will fall within the interval, provided the calibration and test data are exchangeable.
Different conformity scores vary in how they measure prediction errors:
Absolute uses constant intervals based on |y - ŷ|, suitable when prediction errors are roughly constant across the target range. Every prediction gets the same ± adjustment.
Gamma scales intervals proportionally to the prediction using |y - ŷ| / ŷ, appropriate for right-skewed positive data like prices where errors tend to grow with the predicted value.
ResidualNormalised goes further by training a separate variance model to predict how uncertain each individual sample should be. The conformity score becomes |y - ŷ| / σ̂, where σ̂ is a learned estimate of local uncertainty. This produces adaptive intervals: samples the model finds harder to predict get wider intervals, while confident predictions get narrower ones.
These approaches were evaluated using MAPIE, a Python library implementing conformal prediction methods [11]. ResidualNormalised emerged as the best approach, achieving near-exact 70.0% coverage compared to 73.1% for Absolute and 72.1% for Gamma, with the most uniform coverage across price segments. The key advantage is adaptivity: rather than applying the same interval width to all predictions (absolute) or the same relative width (gamma), ResidualNormalised learns which samples are inherently more uncertain and adjusts accordingly.
Combining AutoGluon with Conformal Calibration
The ResidualNormalised conformal approach was implemented directly rather than through MAPIE to allow integration with AutoGluon's ensemble architecture. The process requires careful data splitting to avoid leakage.
Step 1: Split the data. The training data is divided into a training set (for fitting models) and a held-out calibration set (for computing quantiles). The calibration set must not be used during any model training.
Step 2: Train AutoGluon on the training set. The AutoGluon ensemble is trained on the training set only. To obtain residuals for training the variance model, 5-fold cross-validation produces out-of-fold (OOF) predictions for each training sample, where each prediction comes from a model that did not see that sample.
Step 3: Train the variance model. Using the OOF predictions from Step 2, squared residuals are computed: (actual - OOF prediction)². A separate XGBoost model (the variance model) is trained on the training set to predict these squared residuals from the input features. This model learns patterns like "plates with rare letter combinations tend to have larger prediction errors". Squared residuals are used because we need to predict the magnitude of error (not direction), and squaring naturally produces non-negative values.
Step 4: Generate predictions on the calibration set. Both the AutoGluon model and the variance model now predict on the held-out calibration set, which neither model has seen during training. AutoGluon produces point predictions, and the variance model produces uncertainty estimates σ̂ = √predicted_squared_error.
Step 5: Compute calibration quantiles. For each calibration sample, compute the normalized residual: (actual - predicted) / σ̂. For example:
Cal sample 1: (actual €500 - pred €450) / σ̂ 55 = +0.91
Cal sample 2: (actual €200 - pred €350) / σ̂ 141 = -1.06
Cal sample 3: (actual €800 - pred €780) / σ̂ 22 = +0.91
...
Normalization puts all residuals on a common scale: "how many uncertainty units was the prediction off?" This allows finding universal multipliers that work across all samples regardless of their individual uncertainty levels. For 70% coverage, find q_low (15th percentile, e.g., -0.91) and q_high (85th percentile, e.g., 0.90).
Step 6: At inference. For a new plate:
- AutoGluon predicts the price (e.g., €600)
- The variance model predicts the expected squared error (e.g., 10000)
- Take the square root to get
σ̂ = √10000 = 100 - Apply calibration quantiles:
[600 + q_low × σ̂, 600 + q_high × σ̂] = [600 + (-0.91) × 100, 600 + 0.90 × 100] - [€509, €690]
The same q_low and q_high multipliers are applied to every prediction, but because each sample has its own σ̂, confident predictions get narrow intervals while uncertain predictions get wide intervals.
7. Final Model and Results
Model Architecture
The final model combines AutoGluon's automated ensemble construction with the ResidualNormalised conformal calibration approach described in Section 6. AutoGluon selected a WeightedEnsemble_L3 as its best performing model, a three-layer stacked ensemble that combines predictions from multiple base learners including gradient boosting variants (LightGBM, XGBoost, CatBoost), neural networks, and tree-based methods like random forests and extremely randomized trees.
The "L3" designation indicates three stacking levels [12]. At the first level, base models train directly on the input features. At the second level, stacker models train on the original features concatenated with out-of-fold predictions from level one models, allowing them to learn from both the raw data and how previous models performed. The third level applies ensemble selection to aggregate all preceding models predictions through learned weights, with the final weights determined by performance on held-out validation data. This multi-layer architecture allows the ensemble to capture patterns that individual models might miss while reducing overfitting through the use of out-of-fold predictions at each stacking layer.
The ensemble feeds into the conformal calibration pipeline: a separate XGBoost variance model predicts the expected squared error for each sample, and calibration quantiles computed on held-out data transform these variance estimates into prediction intervals.
Final Results
The model was evaluated on a held-out test set of 303 unique plates. The test set reflects the same composition as the training data, with prices adjusted for inflation to 2024 EUR.
| Metric | XGBoost Baseline | AutoGluon + ResidNorm |
|---|---|---|
| MAE | €297 | €238 |
| R² | 0.42 | 0.50 |
| Coverage | 70% | ~72% |
| Mean Interval Width | €661 | €648 |
The final model reduces mean absolute error by approximately 20%, from €297 to €238. For a market where the median listing price is around €450, this represents a meaningful improvement in prediction accuracy. The R² increases from 0.42 to 0.50, meaning the model now explains half of the variance in license plate prices using only the engineered features. The remaining half could potentially reflect factors the model cannot capture: buyer-specific preferences such as personal birthdays or initials, negotiation dynamics, temporal market fluctuations, and the inherent noise in listing prices that may not reflect actual transaction values. Whether additional features, more training data, or fundamentally different modeling approaches could close this gap remains an open question.
Coverage improves slightly from 70% to approximately 72% while interval width decreases marginally from €661 to €648. The prediction intervals remain informative.
Coverage by Price Segment
Examining coverage across price segments reveals where the model performs well and where it struggles.
| Price Segment | Coverage | Mean Width |
|---|---|---|
| <€200 | ~60% | €325 |
| €200-500 | ~80% | €476 |
| €500-1k | ~84% | €886 |
| €1k-2k | ~71% | €1175 |
| >€2k | ~44% | €1600 |
Coverage is strongest in the mid-range segments, achieving over 80% for plates priced between €200 and €1000. The €1k-2k segment maintains reasonable coverage at approximately 71%, close to the target. However, coverage drops substantially at both extremes: around 60% for plates under €200 and 44% for premium plates over €2000.
Limitations
Several limitations constrain the models practical applicability. The training data consists primarily of listing prices rather than confirmed sales, introducing systematic upward bias since asking prices typically exceed transaction prices. With limited confirmed sales, the model may capture seller pricing behavior on these specific platforms as much as underlying market value. The 5% listing discount was informed by research showing items typically sell below list price in negotiated markets [10], but the specific discount was selected via hyperparameter tuning on validation data rather than empirical measurement of ask-to-sale differences in this market. Combined with 3× sale weighting, these adjustments represent informed assumptions rather than validated corrections.
The dataset size of approximately 1500 plates with only ~50 confirmed sales limits the models ability to learn nuanced patterns, particularly for rare premium combinations. The feature set, while informed by domain knowledge about Latvian naming conventions and plate aesthetics, was constrained by what could be reliably learned from limited data.
Temporal effects remain unaddressed beyond basic inflation adjustment. The license plate market may have its own appreciation dynamics distinct from consumer price inflation; collector interest, changes in CSDD policies, or shifts in cultural preferences could affect prices in ways the model does not capture. Additionally, conformal prediction provides coverage guarantees under the assumption that calibration and test data are exchangeable, meaning they come from the same underlying distribution. Given that this dataset spans 2009-2025 and combines multiple platforms, this assumption may not hold perfectly; coverage on future data could differ from reported figures.
Finally, the fundamental latent demand problem persists. A plate's value depends critically on whether the right buyer exists and can be found. The model predicts a kind of average market value, but actual transaction prices may vary.
8. Future Work
Several directions could improve both the model and the understanding of this market.
Data collection and validation. Continued collection of confirmed sales would improve the sales-to-listings ratio and provide more reliable ground truth. Tracking listings over time to observe which actually sell, and at what final price, would enable empirical measurement of the ask-to-sale discount rather than relying on assumptions from other markets.
Phonetic and mnemonic scoring. Some letter-number combinations are "speakable" or form recognizable sounds. For example, BO-55 sounds, looks like "BOSS". An NLP (Natural Language Processing) model could score the pronounceability or mnemonic appeal of plate strings, capturing a value driver that purely structural features miss.
Temporal and economic modeling. The current approach uses simple CPI (Consumer Price Index) adjustment, but collectible markets rarely follow general inflation. More sophisticated approaches could include time-decay weighting where recent listings influence the model more than older ones, or correlation with luxury market proxies such as premium car registrations or the OMX Riga stock index to capture the "wealth effect" on discretionary purchases.
Mondrian conformal calibration. Rather than applying global calibration quantiles, Mondrian conformal prediction computes separate quantiles for different plate categories (e.g., generic, collector, numeric premium). This could address the uneven coverage across price segments, particularly the poor performance at the extremes.
Synthetic demand modeling. The fundamental challenge is that a plate like JB-1985 may hold value only for someone with those initials born in that year. One approach to quantifying this latent demand would be to create a synthetic population of virtual buyers based on Latvian demographic data (name frequencies, age distributions) and simulate which plates each would bid on. This could produce a "synthetic scarcity score" estimating how many people in Latvia would actually want a specific plate, directly capturing the demand side that current features cannot represent.
References
[1] L. Bojić et al., "Comparing large Language models and human annotators in latent content analysis of sentiment, political leaning, emotional intensity and sarcasm," Scientific Reports, vol. 15, no. 11477, 2025. https://doi.org/10.1038/s41598-025-96508-3
[2] V. Chow, "Predicting Auction Price of Vehicle License Plate with Deep Recurrent Neural Network," arXiv:1701.08711, 2017. https://arxiv.org/abs/1701.08711
[3] V. Chow, "Predicting Auction Price of Vehicle License Plate with Deep Residual Learning," arXiv:1910.04879, 2019. https://arxiv.org/abs/1910.04879
[4] F. Ahsan et al., "Predicting License Plate Prices using Machine and Deep Learning," in 2022 International Conference on ICT for Smart Society (ICISS), 2022. https://doi.org/10.1109/ICISS55894.2022.9915267
[5] "Russian Car Plates Prices Prediction," Kaggle Competition. [Online]. Available: https://www.kaggle.com/competitions/russian-car-plates-prices-prediction
[6] A. N. Angelopoulos and S. Bates, "A Gentle Introduction to Conformal Prediction and Distribution-Free Uncertainty Quantification," arXiv:2107.07511, 2021. https://arxiv.org/abs/2107.07511
[7] B. Shalloway, "Understanding Prediction Intervals," 2021. https://www.bryanshalloway.com/2021/03/18/intuition-on-uncertainty-of-predictions-introduction-to-prediction-intervals/
[8] P. K. Ozili, "The Acceptable R-Square in Empirical Modelling for Social Science Research," Social Science Research Network, 2022. https://papers.ssrn.com/sol3/papers.cfm?abstract_id=4128165
[9] "Art Market Valuation Models: Quantitative Approaches to Pricing Contemporary and Historical Works," Museum of Modern Art Analytics. https://momaa.org/art-market-valuation-models-quantitative-approaches-to-pricing-contemporary-and-historical-works/
[10] M. Backus, T. Blake, B. Larsen, and S. Tadelis, "Sequential Bargaining in the Field: Evidence from Millions of Online Bargaining Interactions," Quarterly Journal of Economics, vol. 135, no. 3, pp. 1319-1361, 2020. https://www.nber.org/papers/w24306
[11] V. Taquet et al., "MAPIE: an open-source library for distribution-free uncertainty quantification," arXiv:2207.12274, 2022. https://arxiv.org/abs/2207.12274
[12] N. Erickson et al., "AutoGluon-Tabular: Robust and Accurate AutoML for Structured Data," arXiv:2003.06505, 2020. https://arxiv.org/abs/2003.06505